The Silent Gap: Bridging the Space Between Vital Signs and Clinical Action
In modern high-acuity environments, clinical teams are often inundated with data but underserved by actionable insight. Traditional monitoring relies on static, univariate thresholds, fixed parameters that only trigger once a patient has reached a state of physiological crisis. This creates a systemic paradox - a high volume of non-critical nuisance alerts that contribute to alarm fatigue, while the subtle, sub-clinical shifts that precede a catastrophic event remain undetected.
This case study explores the transition from reactive crisis management to a proactive, predictive care ecosystem. By leveraging the Kaggle Medical IoT Dataset, we demonstrate how engineering patient-specific baselines and monitoring the velocity of physiological decay, rather than absolute values, provides a critical window for intervention minutes before a traditional threshold is ever breached.
Biometric Baseline Analysis: Establishing 'Normal'
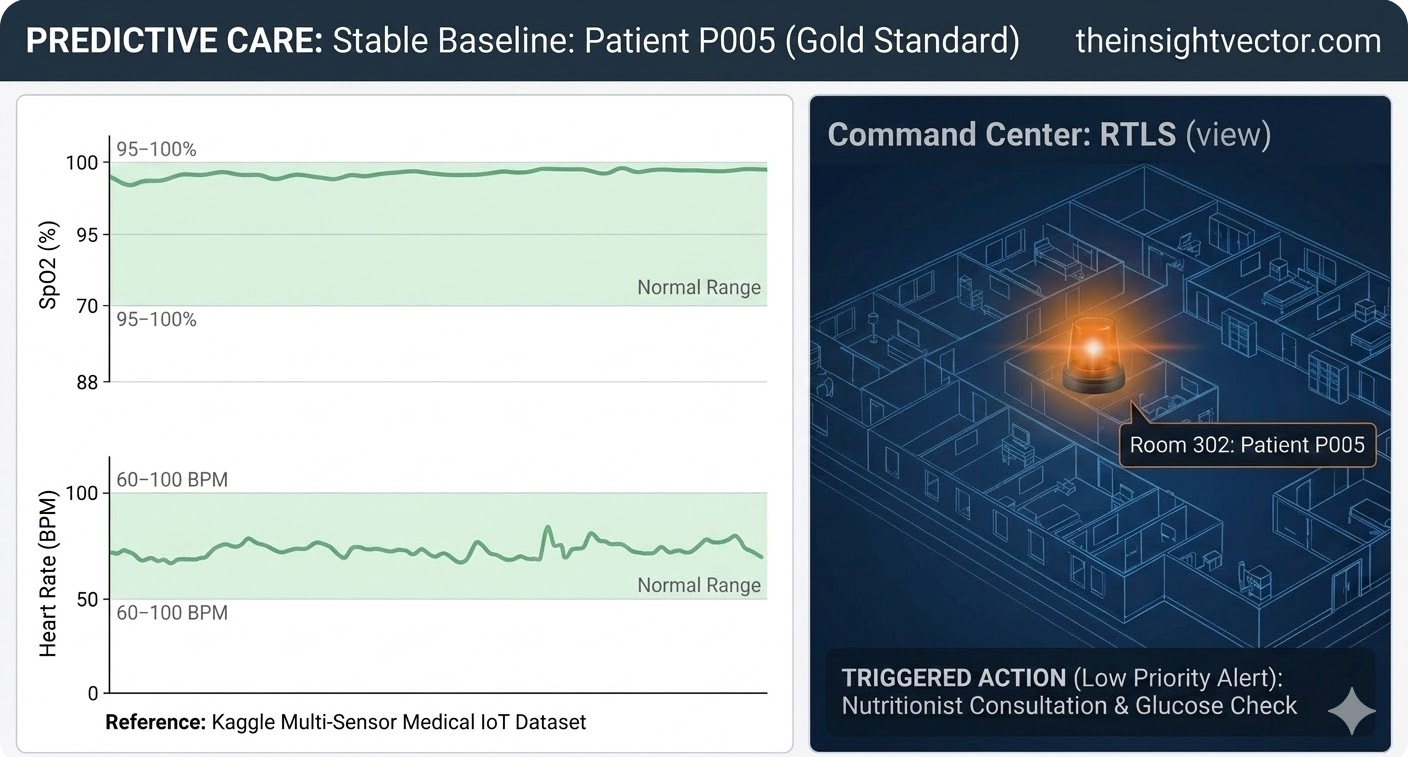
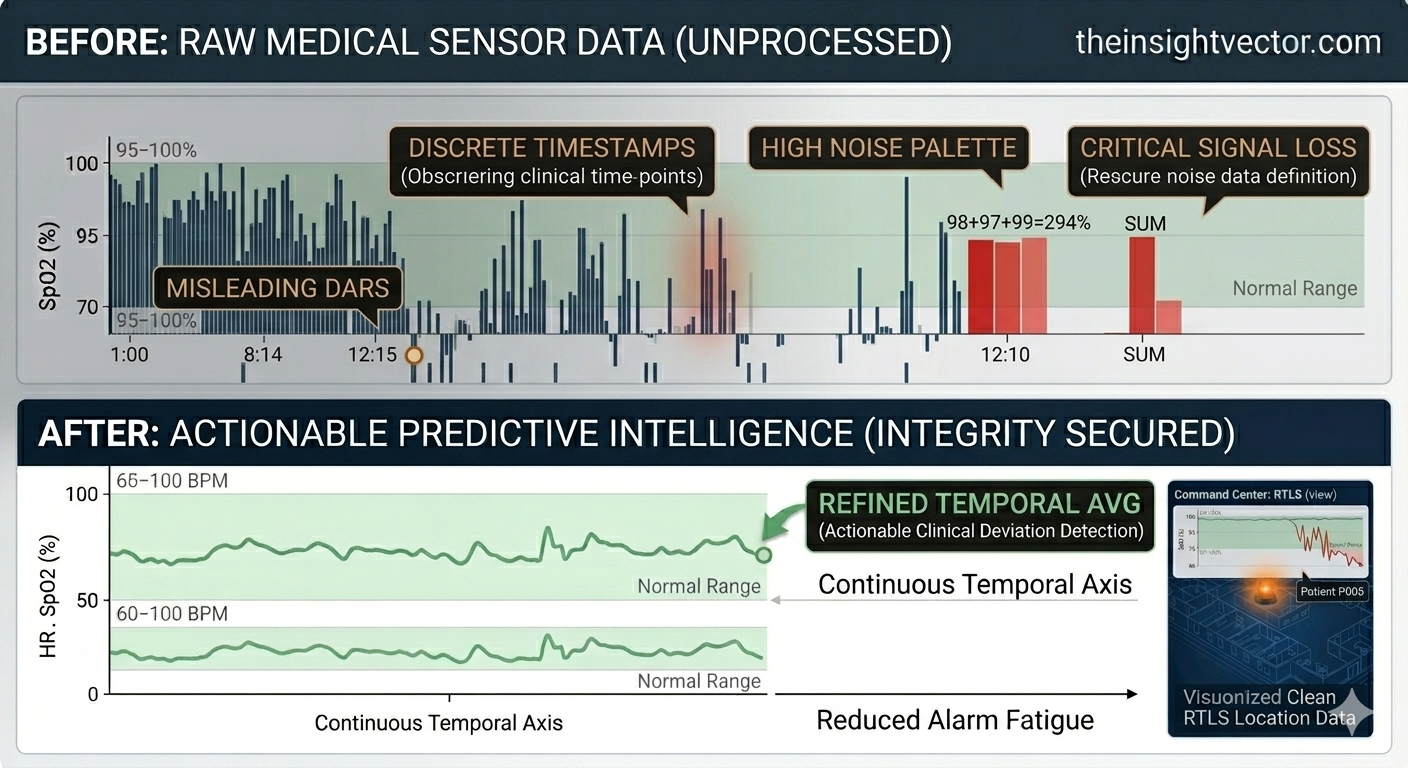
Traditional threshold-based monitoring often creates excessive noise. When sensors trigger alarms for every minor deviation, staff experience alarm fatigue, risking the loss of critical signals in the "static." To build a predictive model, we must first define "Normal."
Using the Kaggle Medical IoT Dataset, we established patient-specific baselines. Our dashboard for Patient P005, our steady reference, utilizes processed multi-sensor data to shade "Normal Ranges" (SpO2 95–100% and Heart Rate 60–100 BPM) in green. This optimized interface filters out noise, allowing clinicians to move from reactive alarm-chasing to a proactive, predictive care model.
Real-Time Detection: Trend over Threshold
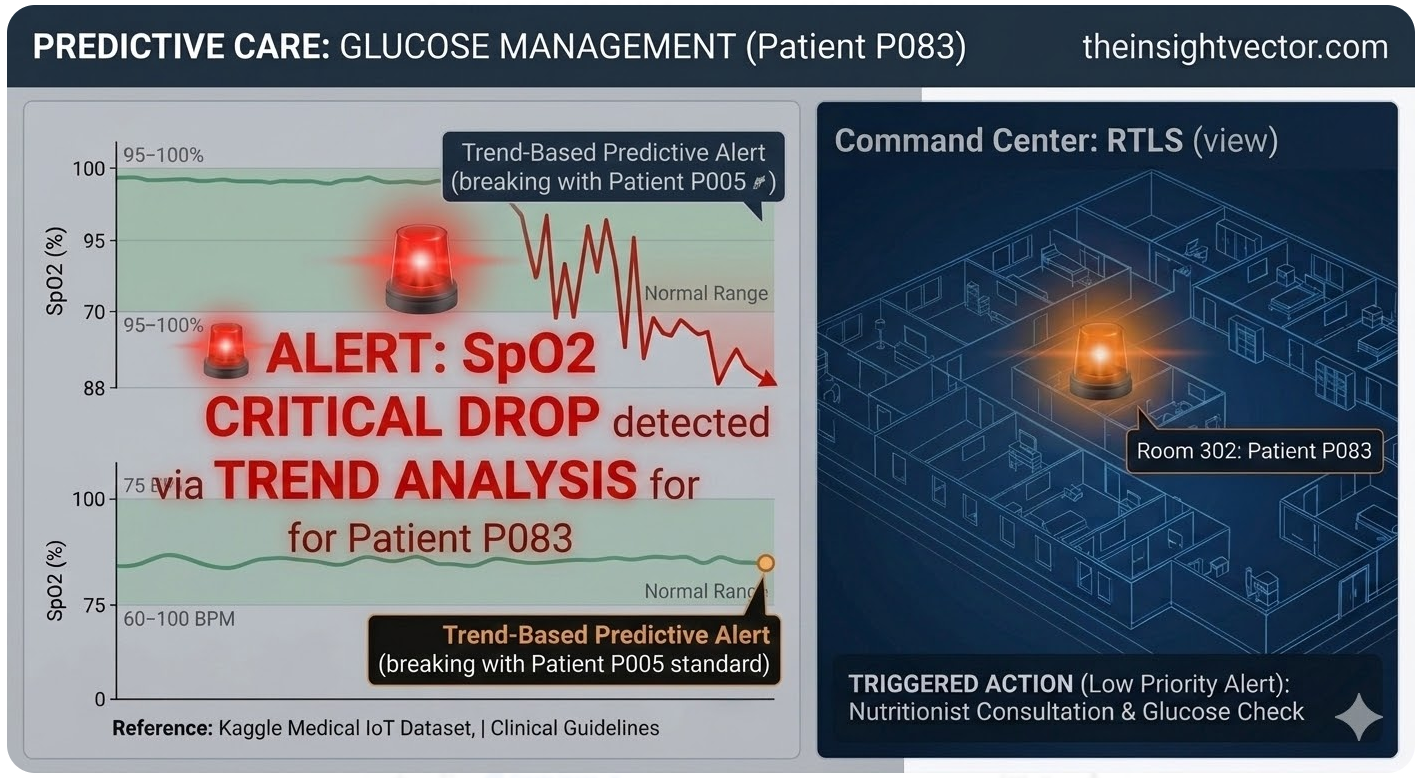
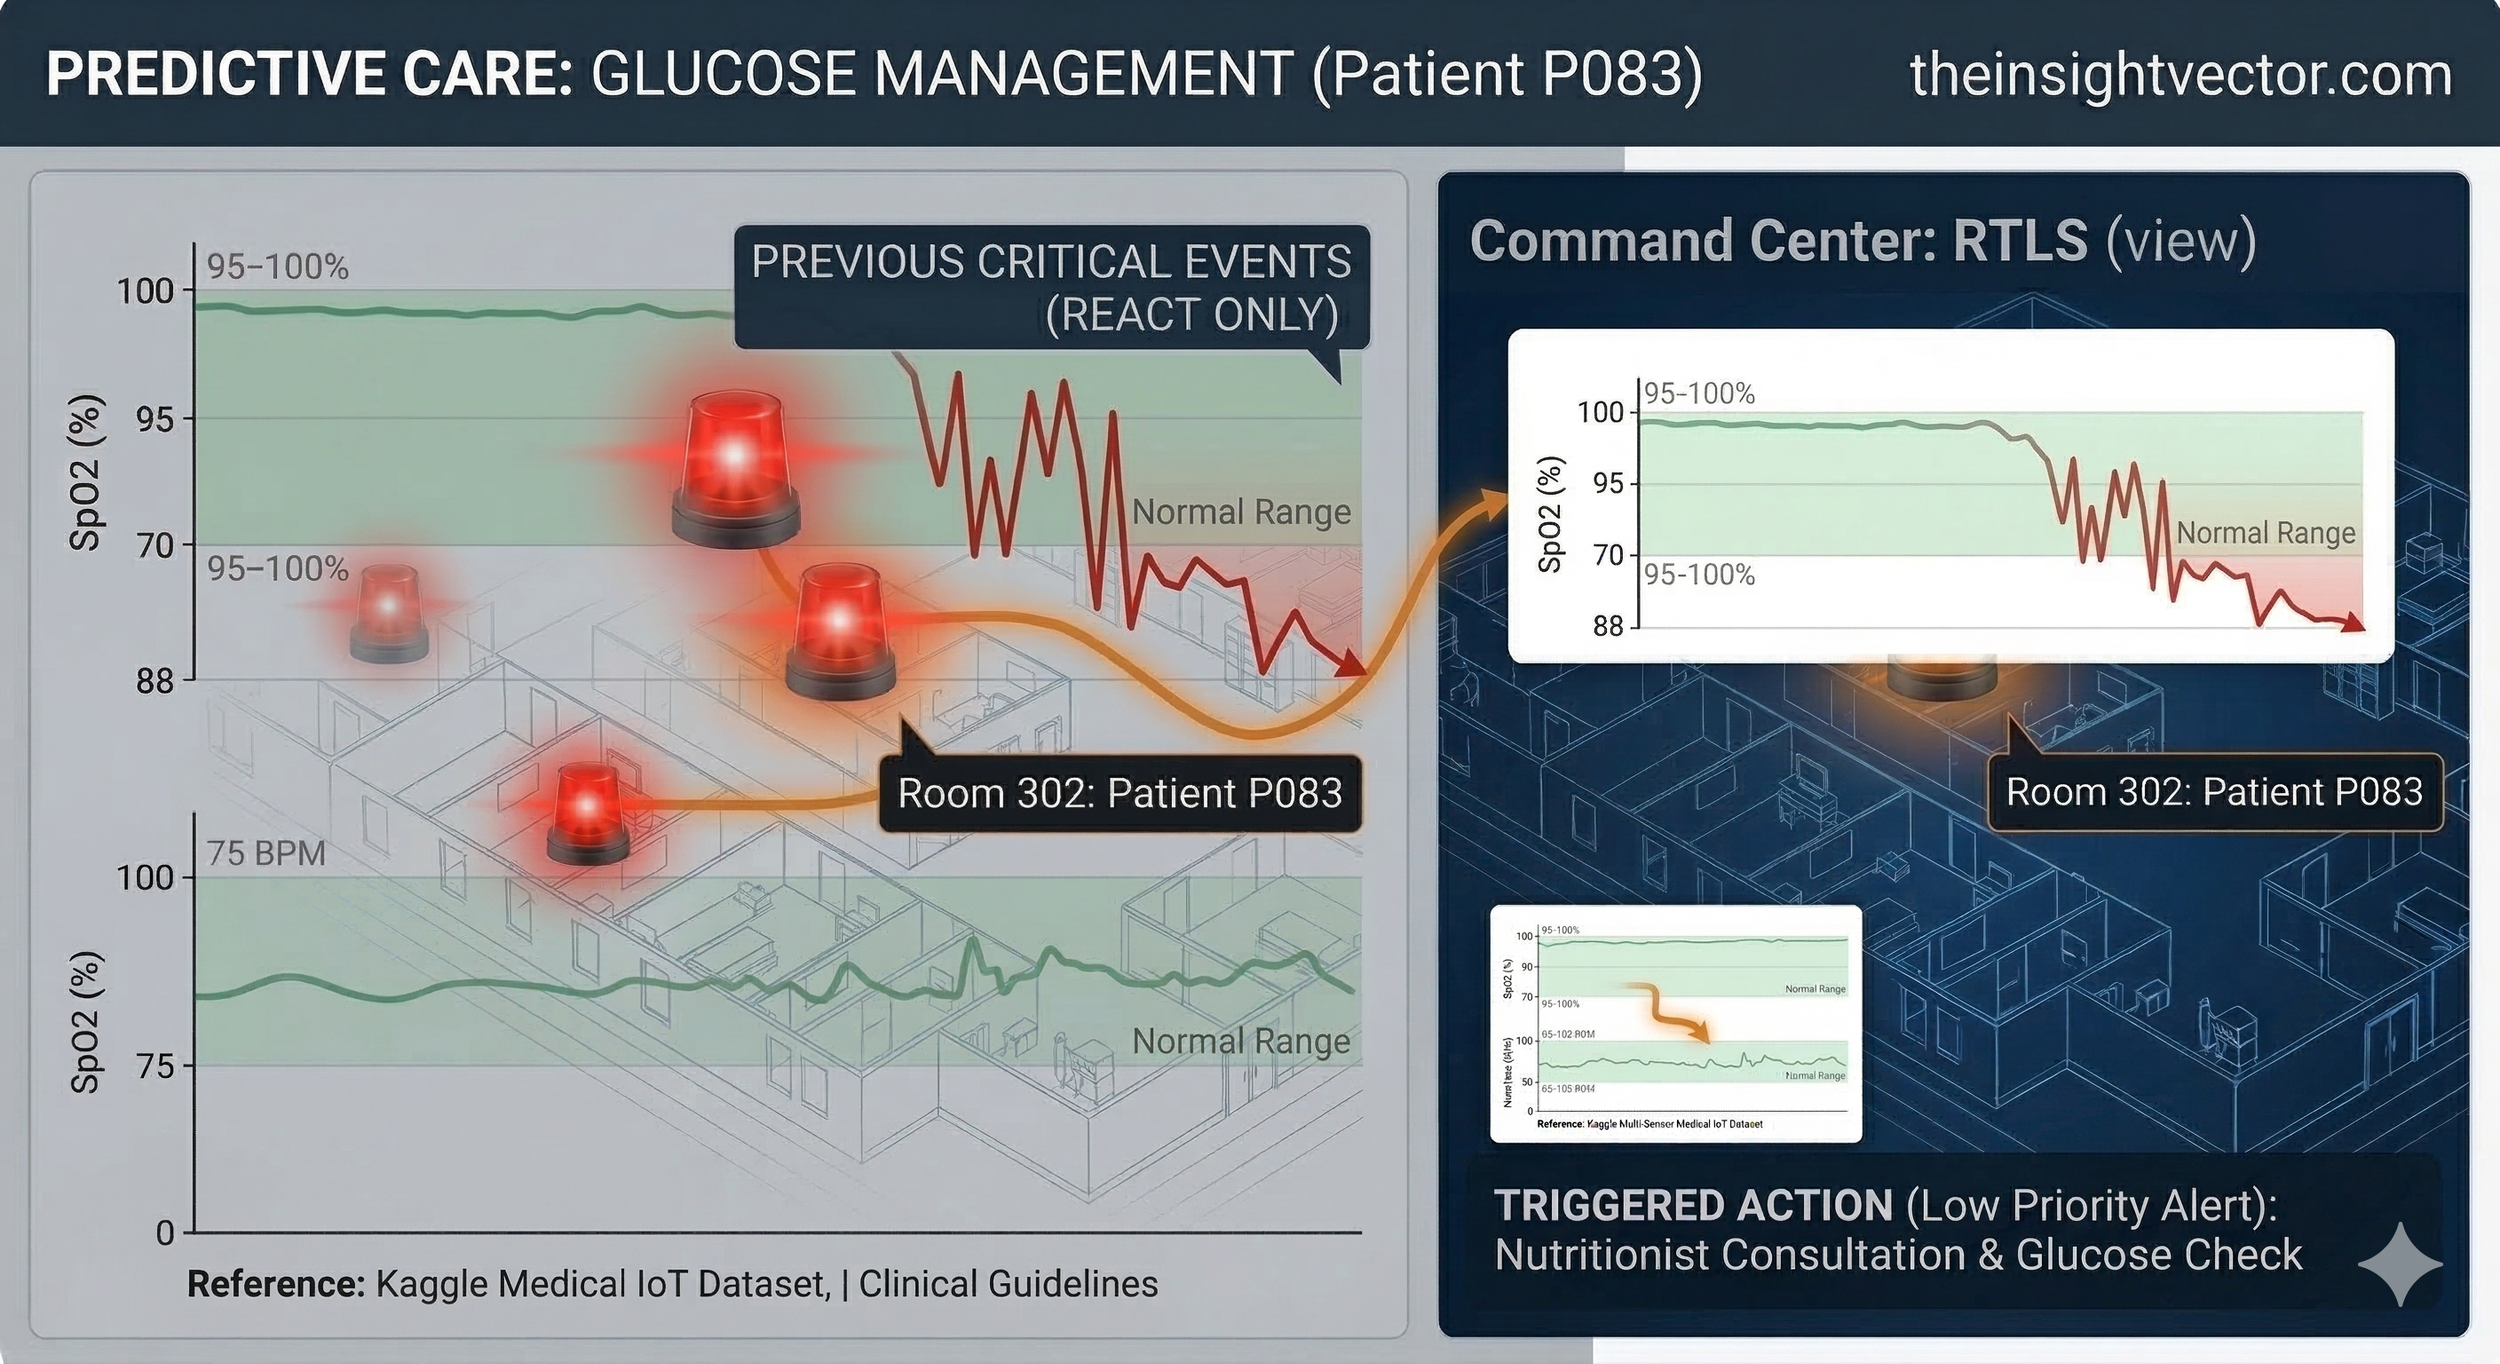
While P005 represents the baseline, Patient P083 represents the failure of traditional monitoring. In a standard setup, an alarm triggers only when SpO2 hits a 90% floor. Our model instead monitors the Slope of Decay.
As P083’s SpO2 dropped from 98% to 92%, the rate of decline - the First Derivative -triggered an alert. This identified a "Silent Hypoxia" risk four minutes before a binary threshold would have reached a crisis point. While the Heart Rate remained a deceptively steady 75 BPM, the volatile trend line broke the shaded "Normal" zone, triggering an immediate clinical response.
Command Center & RTLS Response
When custom code triggers a hypoxia alert, it integrates instantly with the hospital’s Real-Time Location System (RTLS). In the Command Center view, a glowing red beacon pulses from Room 302, with a digital pathway tracing the trajectory from the alert center directly to the bedside. This is the bridge between data insight and physical, real-time intervention.
From Reactive Crisis to Proactive Glycemic Management
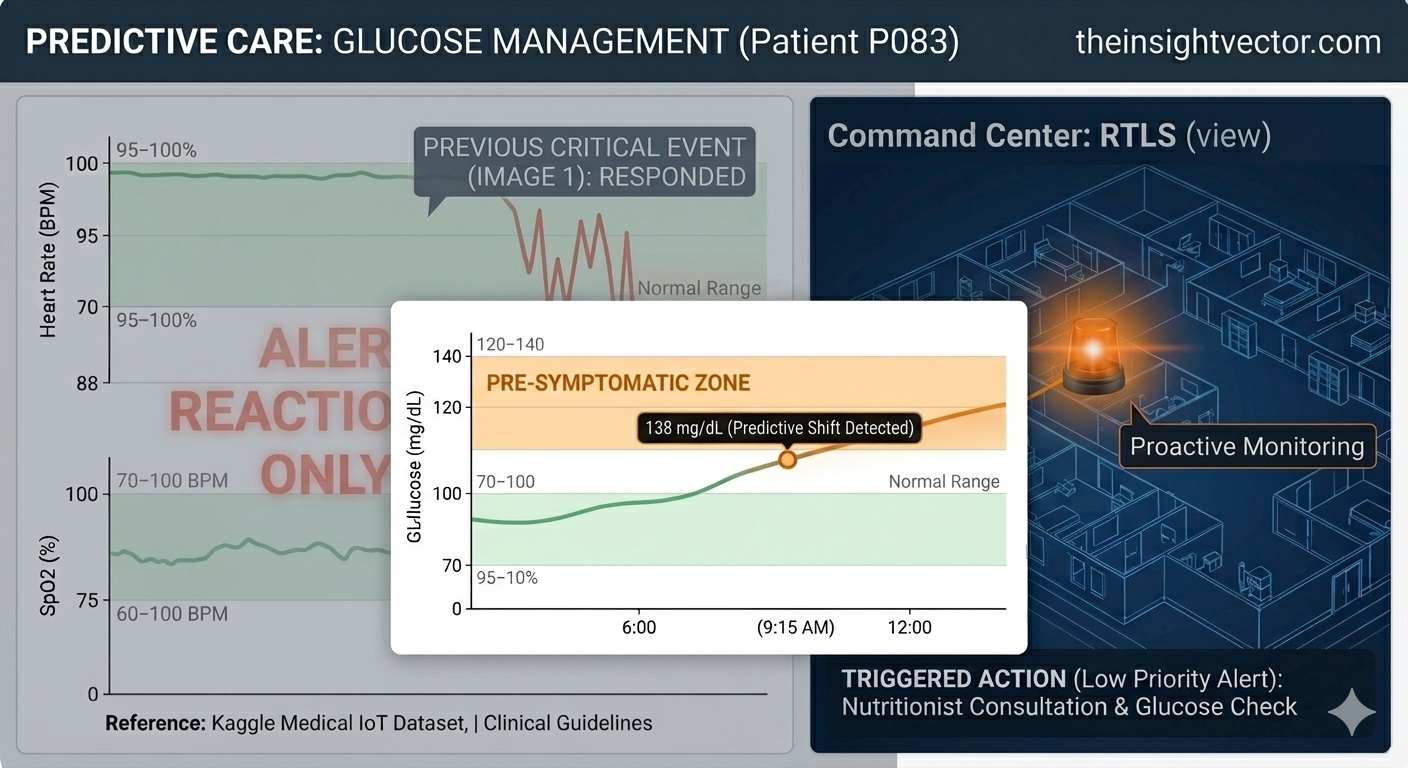
The shift from Hypoxia (Crisis) to Glucose (Management) demonstrates the model's scalability. We aren't just looking for emergencies; we are looking for Sub-Clinical Shifts.
Traditional models only scream after a threshold is breached. In contrast, our glucose monitoring identifies trends that are technically "normal" by hospital standards (moving toward 138 mg/dL) but statistically significant for the patient’s history. Instead of an urgent RTLS dispatch, the system generates a Low-Priority Work Order. By treating a trend before it becomes a symptom, we reduce "Code Blue" events and optimize staff allocation during scheduled rounds rather than mid-crisis.
Solving the Data Aggregation Challenge: Building a Unified Biometric Pipeline
Predictive Care Ecosystem: The Path Forward
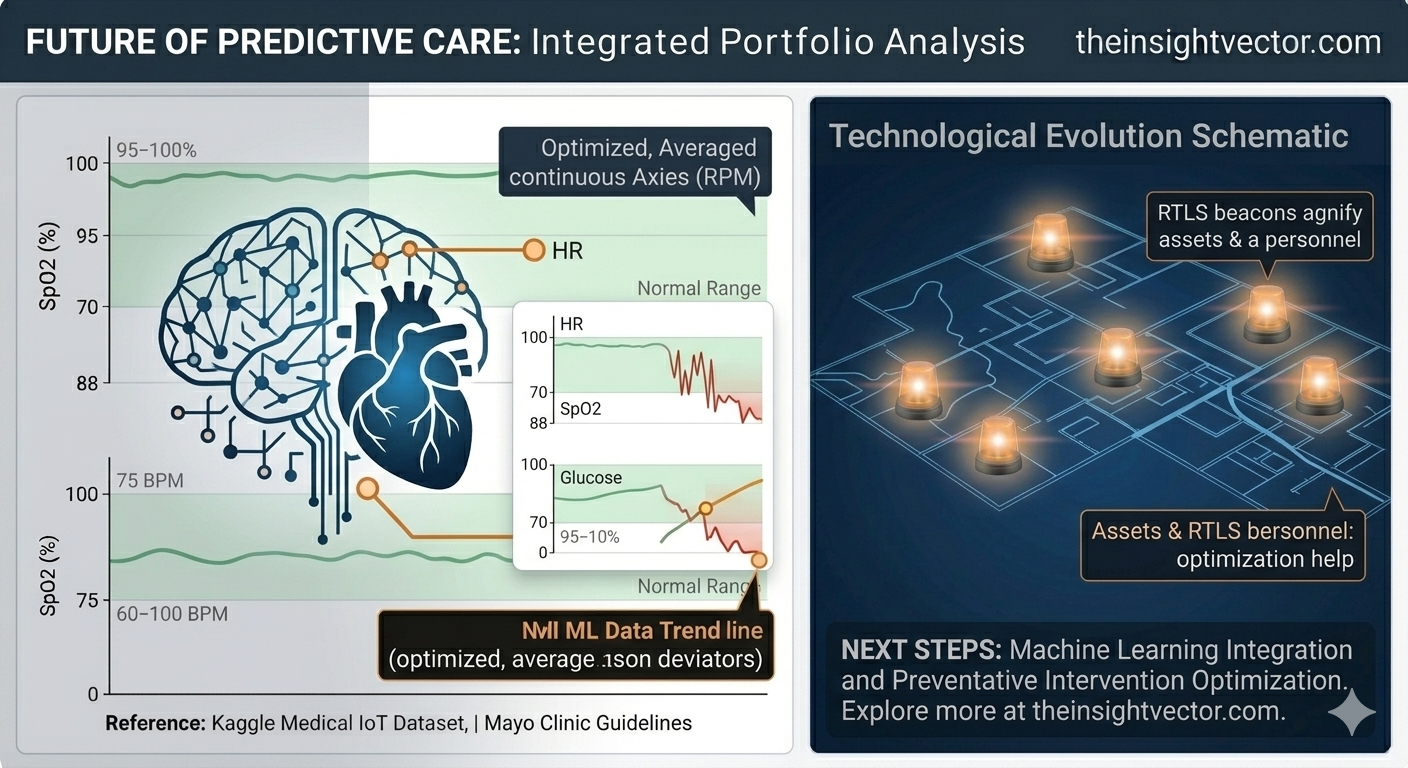
By solving the data aggregation challenge, we transformed raw biometric noise into actionable intelligence. This integrated ecosystem, from stable baselines to real-time operational response, is now ready for advanced Machine Learning integration. We have defined the process required to move from reactive detection to proactive prevention, delivering measurable value in a capitated, value-based care environment.